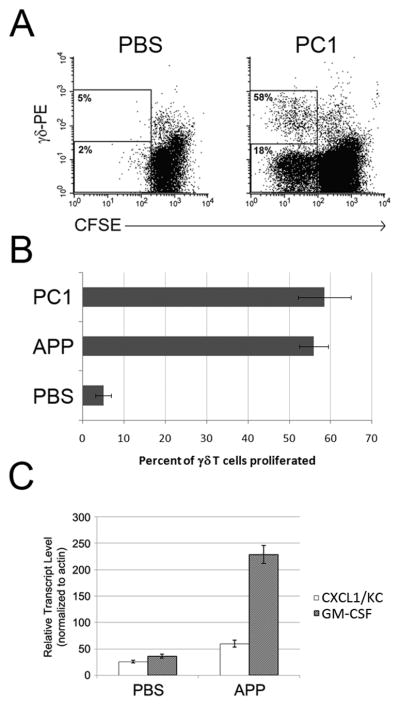
Figure 1. APP and/or purified procyanidin (PC1) prime mouse γ δT cells to proliferate in response to IL-2 and induce CXCL1/KC and GM-CSF transcript expression in murine splenocytes.
A) CFSE-labeled BALB/c splenocytes were cultured in X-VIVO-15 medium with PBS or PC1 (15μg/mL) for 24h. Culture supernatant fluid was then replaced with fresh medium containing 1ng/mL rhIL-2 and cultured for an additional 72h. Cells were then stained for γ δTCR (GL3) and analyzed by flow cytometry. A representative example of a two-color FACS plot from one of three experiment repeats is shown. Values represent the percent proliferated of either the γ δT cell (top region) or non-γ δT cell (bottom region) populations. Percent proliferation was measured by dividing the number CFSE-dim cells (gated) from the number of total cells in the respective population. B) Experiments performed as described in (A) were also completed using spleen cells from C57Bl/6 mice, and responses to APP and PC1 compared. Data represent the average +/− SD from 3 experiments (P<0.001 for both APP and PC1 vs. buffer control). C) Spleen cells isolated from BALB/c mice were treated with APP or PBS in X-VIVO for four hours. RNA was extracted from each sample and subjected to quantitative RT-PCR for actin, GM-CSF, and CXCL1/KC. Results represent mean +/− SD from triplicate values.

