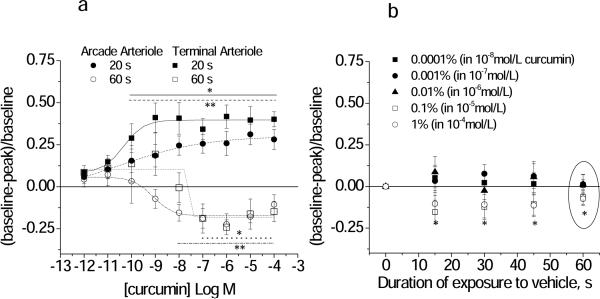
Figure 2.
Concentration response relationship for curcumin+vehicle (A) or vehicle alone (B, ethanol) applied to arcade and terminal feed arterioles (Protocol 1). (A) The Early response was obtained at 20 seconds and the Late response was obtained at 60 seconds of continuous exposure to curcumin. The EC50 and maximal values are given in Table 1. *terminal **arcade: individual responses differ from baseline, p<0.05. (B) Time course of the response to ethanol alone, showing the percent ethanol (in the corresponding curcumin solution). Terminal and arcade arterioles are combined. The response at 60 s (circled) corresponds to the Late time point in (A) for all ethanol concentrations. *differs from baseline for 0.1 and 1% ethanol only, p<0.05.

