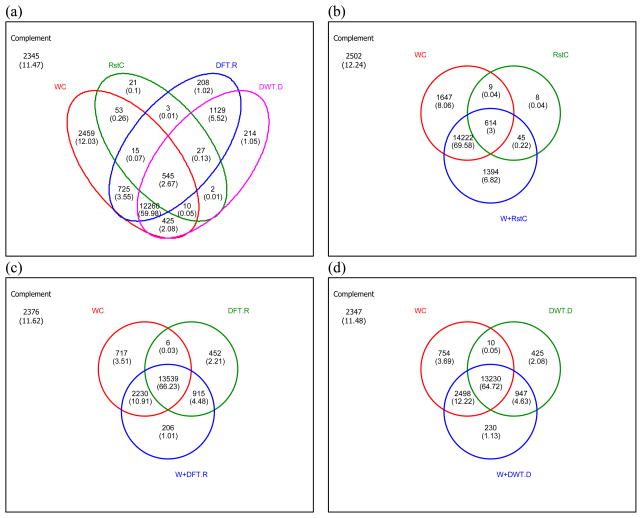
Figure 3.
The Venn diagram analysis of the simple similarities for compound identification. The values inside the Venn diagram are the number of spectra identified correctly and the values in parentheses the percentages (%) of the number of spectra identified correctly out of 20,441 spectra. (a) The Venn diagram for the four simple similarities, WC, RstC, DFT.R, and DWT.D. (b) The Venn diagram for WC, RstC, and W+RstC. (c) The Venn diagram for WC, DFT.R, and W+DFT.R. (d) The Venn diagram for WC, DFT.D, and W+DFT.D.

