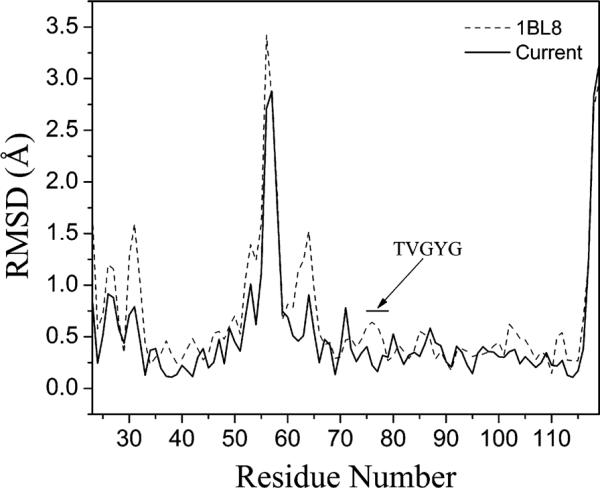
Figure 2. Main Chain Rmsd of the Normal-Mode-Refined Model and the Original Isotropic Model with Respect to the 2.0Å Structure of KcsA.

The normal-mode-refined model is denoted by the solid line, and the original isotropic model is denoted by the dashed line. The black bar highlights the selectivity filter (residues 75–79 with signature sequence TVGYG). The comparison was made based on a single subunit.
