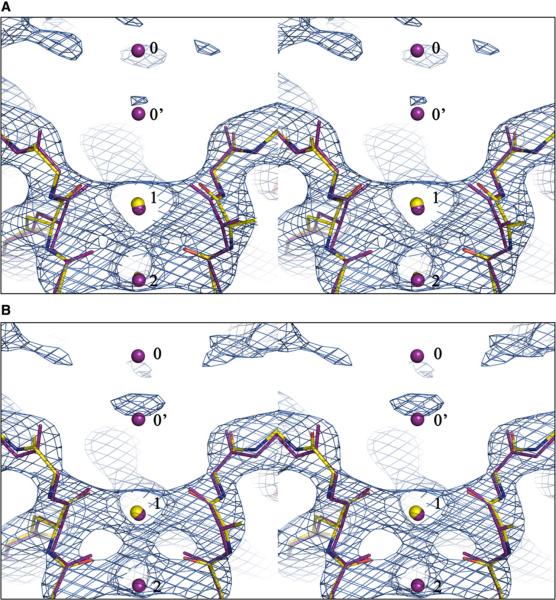
Figure 3. Improvement of the Structural Model of KcsA in the Selectivity Filter Region.
(A and B) Shown are stereo views of the superposition of the 3.2Å structure (colored by atoms) with the 2.0Å structure (red). The superposition was based on the main chains of the TVGYG sequence of all four subunits. (A) The original model. (B) The normal-mode-refined model. The 2Fo–Fc maps for the 3.2Å structures are contoured at 2.0σ.K+ ions in the filter are numbered as 1 and 2 according to the 2.0Å structure, and the two alternate positions for a single K+ ion at the entryway revealed in the 2.0Å structure are numbered as 0 and 0′ for easy reference. A strong new density is observed near the 0′ position in the 2Fo–Fc map for the normal-mode-refined model. It is evident that the new model is more similar to the 2.0Å structure than the original model.

