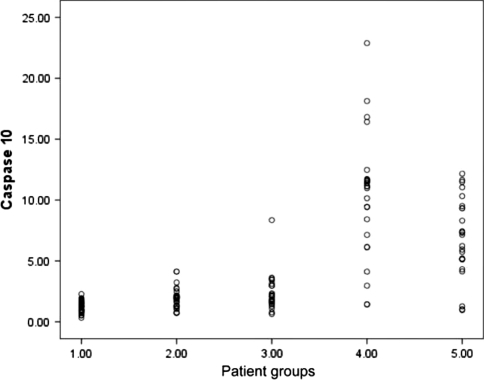
Fig. 6.
Represents scatter plot diagram of Caspase-10 activity at the basal level, (1.00) before culture [1.26(0.33–2.28)] and after culture under different condition,(2.00) neutrophils patients with sera of healthy control [1.97(0.72–4.13)], (3.00) cultured patients neutrophils with their own sera after addition of GM-CSF [2.29(0.03–8.35)], (4.00) Patients neutrophils with their own sera [10.31(1.42–22.89),)], (5.00) cultured healthy neutrophils with patients sera [6.57(0.96–12.17)]. The difference was statistically significant (P < 0.001). The neutropenic patient’s sera induce the highest apoptotic effect on both patient neutrophil and healthy control neutrophil and addition of GM-CSF downregulate the apoptotic effect of patient’s sera

