
Figure 4.
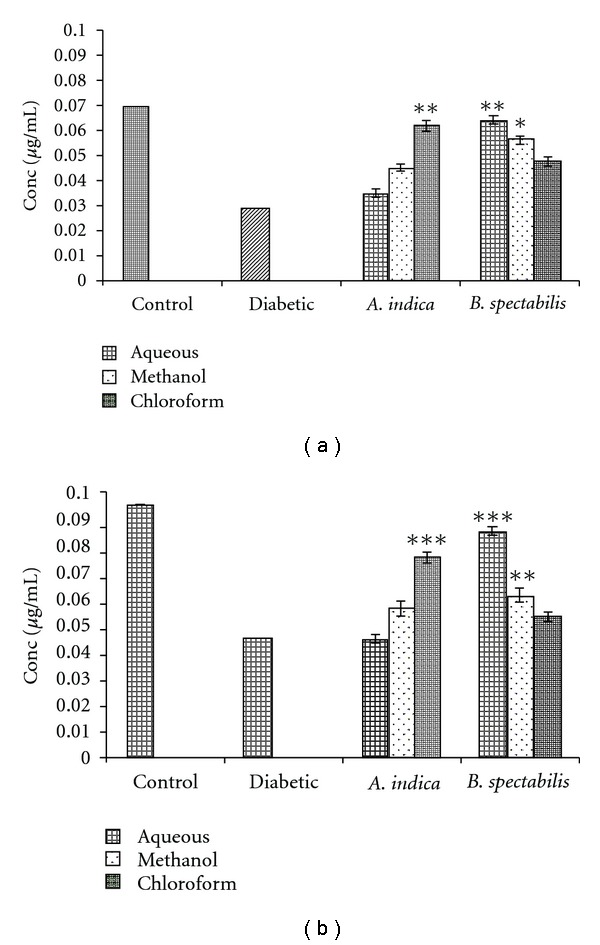
Indicates glycogen storage of (a) liver and (b) skeletal muscle post-treatment. Data was calculated as mean ± SEM (n = 6). The student t-test was used where bars with different asterisks (***, **, *) shows a significant difference with respect to control where P < .05.