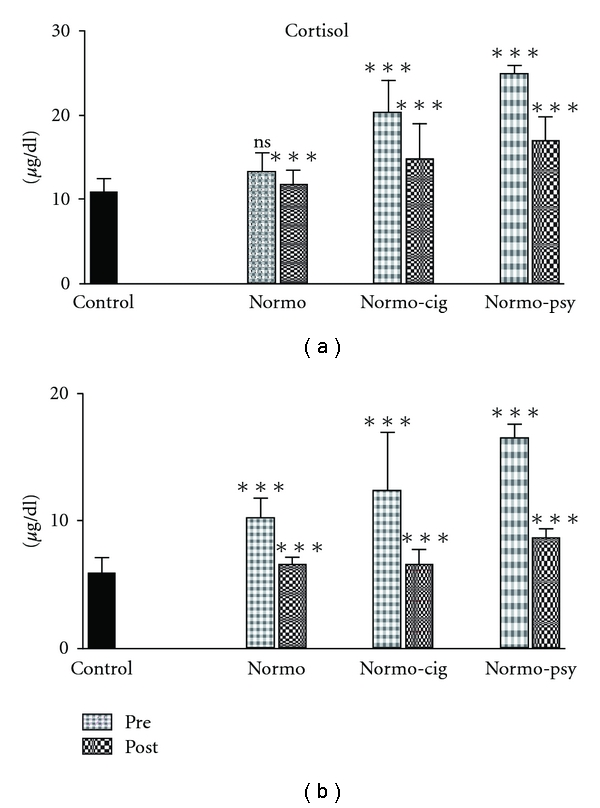
Figure 4.

Bar diagram showing average serum cortisol levels at 8 a.m. (a) and 4 p.m. (b) in patients before and after treatment with W. somnifera. The asterisks on bars of pretreatment group show significant difference from control and posttreatment group show significant difference from pretreatment. The error bars show standard deviation.
