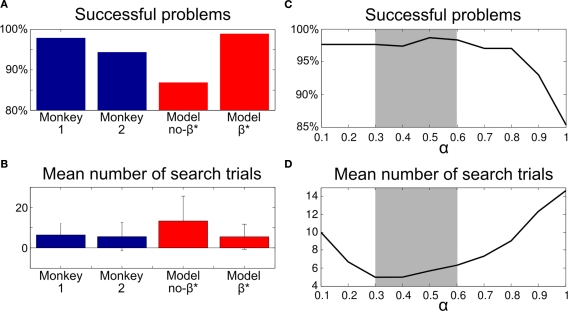
Figure 8.
Comparison of simulated results and monkey performance in Experiment 2. (A) Percentage of problems where the agent did eventually find the correct target and passed the criterion for a correct repetition phase. (B) Performance during search trials. (C) Percentage of Successful problems for different values of α tested with the model with β*. (D) Duration of the search phase for the same tests. Without the dynamic regulation of the exploration level computed with β*, the model produced worst performance than monkeys. Errorbars: SD.

