
Figure 2.
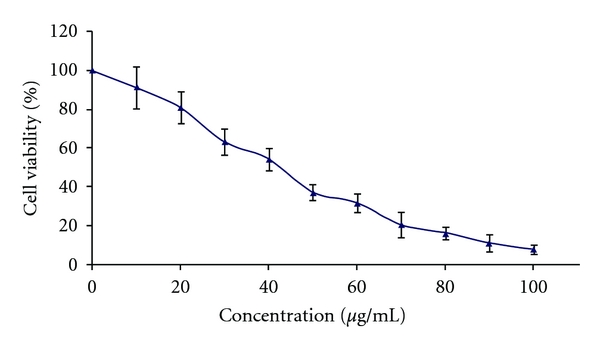
MTT-dose-response relationship of a GE (P. quinquefolius) after 72 h incubation with 3T3-L1 cells assessed by an MTT viability assay. Values are expressed as percentage of untreated control cells (mean ± SD).
Official websites use .gov
A
.gov website belongs to an official
government organization in the United States.
Secure .gov websites use HTTPS
A lock (
) or https:// means you've safely
connected to the .gov website. Share sensitive
information only on official, secure websites.
MTT-dose-response relationship of a GE (P. quinquefolius) after 72 h incubation with 3T3-L1 cells assessed by an MTT viability assay. Values are expressed as percentage of untreated control cells (mean ± SD).