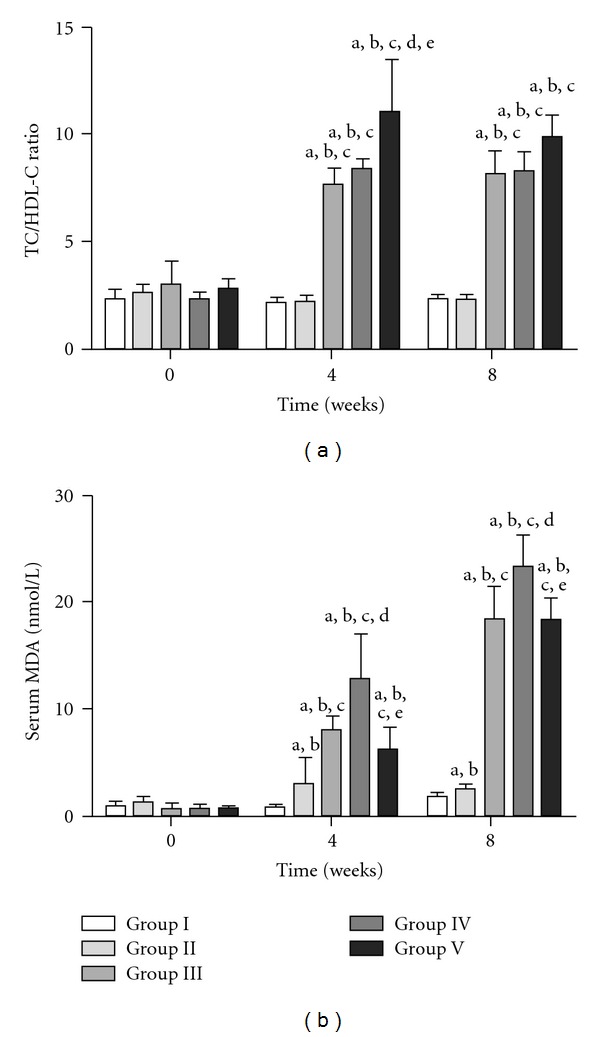
Figure 3.

Sequential changes in TC/HDL-C ratio and serum MDA in the five groups. Results are expressed as mean ± SD. a P < .05, 0 time versus 4 and 8 weeks in the respective groups. b P < .05, Group I versus other groups. c P < .05, Group II versus Group III, IV or V. d P < .05, Group III versus Group IV or V. e P < .05, Group IV versus Group V.
