
Figure 3.
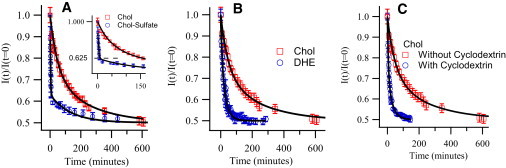
(A) Comparison of normalized intensity decay curves for normal cholesterol and cholesterol-sulfate in POPC vesicles at 50°C (inset expands the view at the breakpoint). (B) Comparison of normalized intensity decay curves for DHE and normal cholesterol in POPC vesicles at 50°C. (C) Comparison of normalized intensity decay curves for cholesterol in POPC vesicles with and without the presence of 2 mM cyclodextrin at 50°C.