
Figure 3.
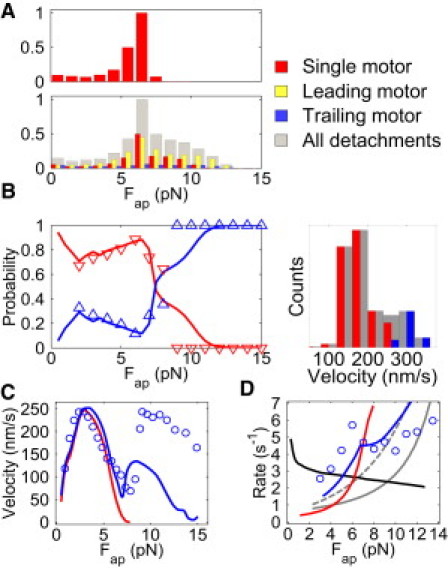
Predicting two-kinesin behaviors in an optical trap. (A) Histograms describing the force-dependent detachment distributions for the two-kinesin complex. Bin amplitudes are normalized by the peak bin in the cumulative histogram (gray). (B) The probabilities that a two-kinesin complex will adopt load-bearing microstates (red line) and nonload-bearing microstates (blue line) as a function of applied load. Optical trapping data are presented as triangles. The load-bearing probabilities are calculated as the fraction of beads at a given force that are driven by two microtubule-bound motors, each bearing at least 35% of the applied load. The nonload-bearing population fraction consists of both single- and two-motor-bound populations that do not meet this load-sharing criterion. A velocity distribution Fap = 5 pN is also provided; the color code is identical in each plot. (C) Average bead velocities for single kinesins (red line) and a two-kinesin complex (blue line). (D) Calculated average motor binding (kon[1→2]) and detachment (koff[2→1]) transition rates. Experimentally measured two-kinesin velocities and detachment rates are indicated by the blue circles in C and D.