
Figure 2.
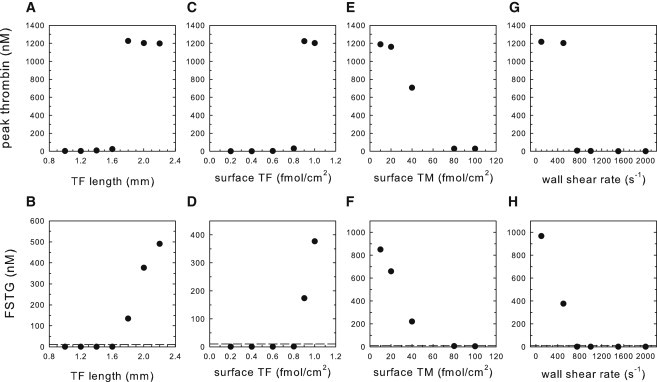
Threshold response of thrombin to TF site length, TF surface density, and TM surface density under simulated arterial flow (500 s−1). (A and B) Peak thrombin concentration and FSTG as functions of TF length at a wall shear rate of 500 s−1. [TF] and [TM] were 1 and 1000 fmol/cm2, respectively. (C and D) Peak thrombin concentration and FSTG as functions of TF surface density. TF and TM lengths were 2 and 34 mm, respectively. [TM] was fixed at 1000 fmol/cm2. (E and F) Peak thrombin concentration and FSTG as functions of TM surface density. [TF] was fixed at 0.8 fmol/cm2. (G and H) Peak thrombin concentration and FSTG as functions of wall shear rate. TF and TM lengths were 2 and 34 mm, respectively. [TF] and [TM] were 1 and 1000 fmol/cm2, respectively. Simulations were run to 60 min. Activation of clotting is defined at FSTG of 10 nM (dotted line).