
Figure 3.
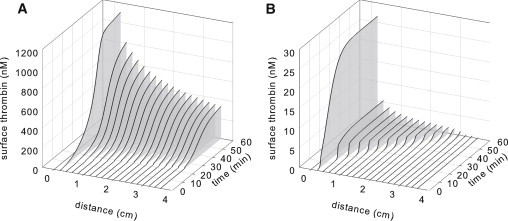
Thrombin concentration at various points along the surface as a function of time for systems that lie (A) above, with [TF] of 0.9 fmol/cm2 and [TM] of 1000 fmol/cm2, or (B) below, with [TF] of 0.8 fmol/cm2 and [TM] of 1000 fmol/cm2, a prothrombotic activation threshold at 500 s−1. Note the different scales.