
Figure 6.
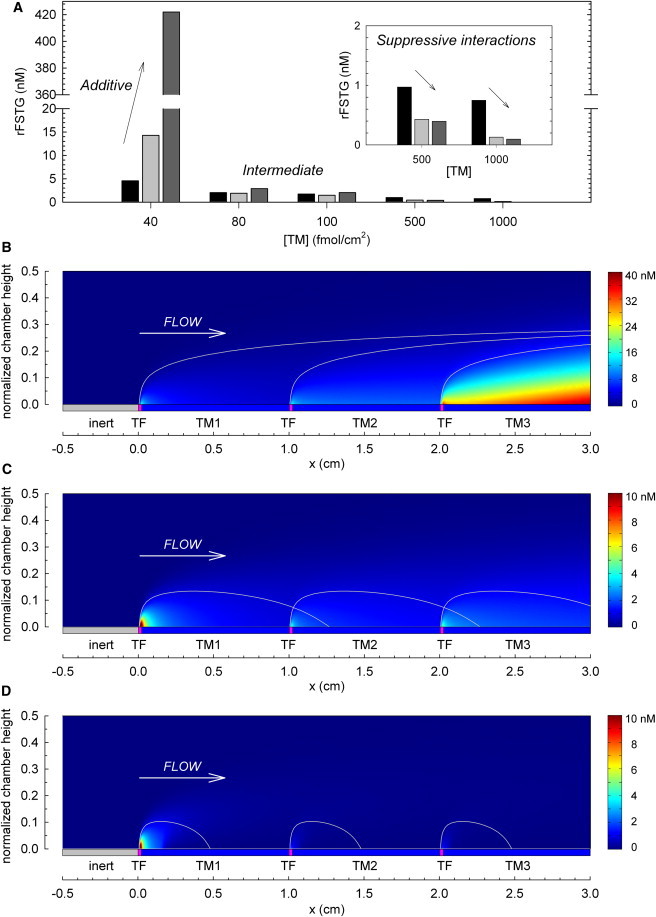
Additive, intermediate, and suppressive interactions between tandem prothrombotic sites. (A) rFSTG as a function of intervening TM surface density (40–1000 fmol/cm2) under simulated arterial conditions (500 s−1) over three sequential sites of TF (TFlength = 200 μm, [TF] = 9 fmol/cm2). From left to right, each bar represents rFSTG for the regions downstream of each site of surface-bound TF. (B–D) The EPZ, previously calculated from a simulation of a single site of TF, is overlaid on the surface plot to illustrate the overlap of EPZ between sequential TF sites. Included are representations of additive effects at low surface densities of TM (40 fmol/cm2) (B), the net effect of both additive and suppressive interactions between TF sites at intermediate surface concentrations of TM (100 fmol/cm2) (C), and suppressive interactions between TF sites at high surface concentrations of TM (1000 fmol/cm2) (D). Simulations were run to 60 min. However, thrombin concentration profiles shown here are at t = 18 min to avoid scaling artifacts. Note the different scale bars.