
Figure 6.
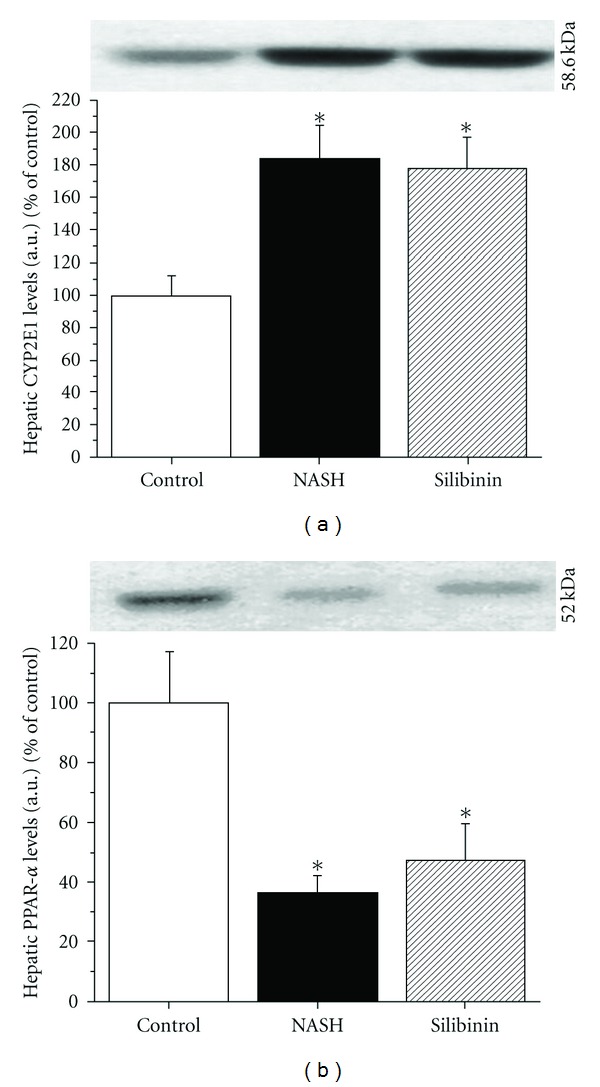
Effect of silibinin on CYP2E1 and PPAR-α. Representative western blots presented were performed on liver microsomal fraction for CYP2E1 (a) or whole liver homogenates for PPAR-α (b) to reveal their protein expression. Livers were obtained from rats in the fasting state, after 12 weeks of standard diet (CTL), high-fat diet alone (NASH) or supplemented with silibinin–phosphatidylcholine complex (SIL), at a dose of 200 mg kg−1 as silibinin, during the last 5 weeks. Values are expressed as means ± SE of 6–8 samples for each group. *P < .05 versus control group.