
Figure 4.
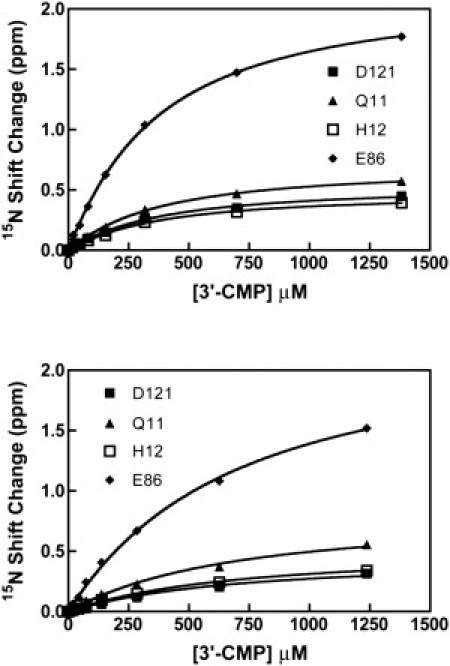
Binding of 3′-CMP to RNase A. (Top) H48C-4MI (bottom) H48C. 1H,15N chemical shift changes for four residues are plotted versus the concentration of 3′-CMP at pH = 7.0, 298 K. All data are fit with a single global one-site binding model.
Official websites use .gov
A
.gov website belongs to an official
government organization in the United States.
Secure .gov websites use HTTPS
A lock (
) or https:// means you've safely
connected to the .gov website. Share sensitive
information only on official, secure websites.
Binding of 3′-CMP to RNase A. (Top) H48C-4MI (bottom) H48C. 1H,15N chemical shift changes for four residues are plotted versus the concentration of 3′-CMP at pH = 7.0, 298 K. All data are fit with a single global one-site binding model.