Figure 1.

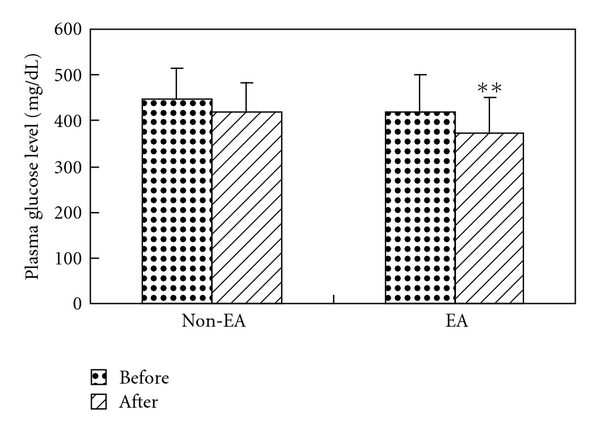
Hypoglycemic effects of ST-36 EA in STZ rats: EA represents fasting for 12 h and EA treatment for 30 min; non-EA represents the non-EA control group; comparison of plasma glucose levels was performed by self-pair t-test, **P < .01.

Hypoglycemic effects of ST-36 EA in STZ rats: EA represents fasting for 12 h and EA treatment for 30 min; non-EA represents the non-EA control group; comparison of plasma glucose levels was performed by self-pair t-test, **P < .01.