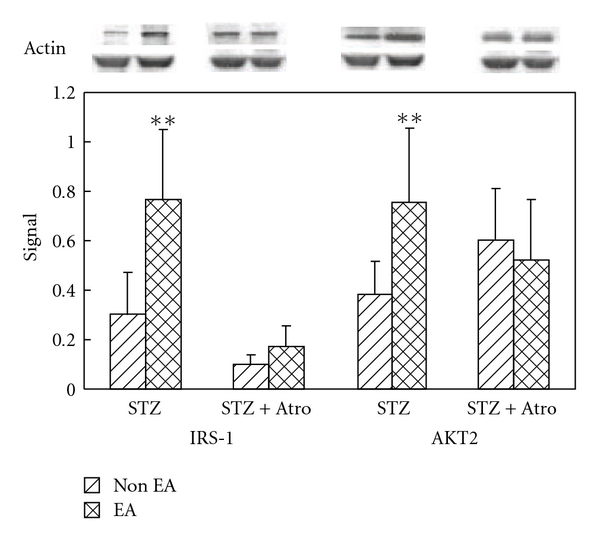
Figure 2.

Effect of EA and atropine on the expression of muscular insulin signaling proteins. All signaling protein values were calculated as a ratio of signal protein to actin. The ratios were compared within the groups. Signal: signal protein/actin ratio, STZ group: the STZ-induced diabetic rats were treated with normal saline as a control, STZ + Atro group: the STZ-induced diabetic rats were treated with atropine 0.1 mg kg−1 for 30 min before EA and non-EA. The Student's t-test was used to compare the means between the EA and non-EA groups, **P < .01 was considered statistically significant.
