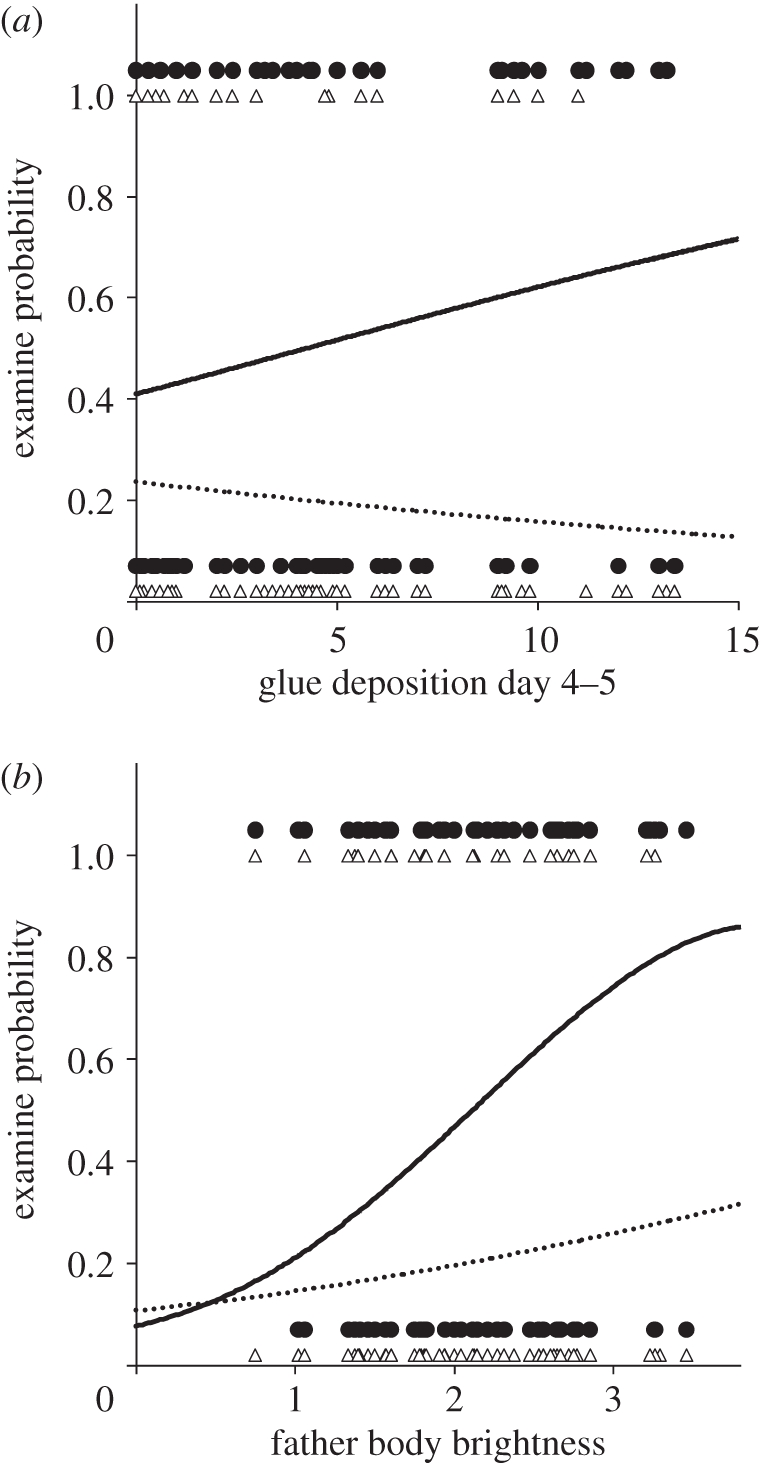
Figure 3.

Influence of father olfactory and visual traits on daughter preference. Daughter preference plotted against father glue deposition and body brightness. Relationship shown for mates of the father's species (filled circles and solid line) and mates of the other species (open triangles and dashed line). Lines indicate predicted probability from the generalized linear model. Backtransformed values are shown. Data points jittered to improve visualization. (a) Glue deposition rate on days 4 and 5: βFather = 0.09 ± 0.06; βOther = − 0.05 ± 0.06. (b) Father body brightness score: βFather = 1.18 ± 0.43; βOther = 0.36 ± 0.37.
