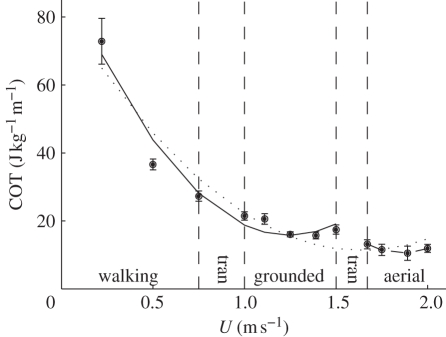
Figure 5.
Cost of transport (COT; J kg−1 m−1) plotted against forward speed (U; m s−1). The polynomials are described by the equations COT = 82.835 − 87.175U + 26.564U2 (dotted line through all speeds; F2,9 = 59.564, r2 = 0.93, p < 0.001), COT = 94.312 − 126.343U + 50.805U2 (solid line through walking and grounded running data only; F2,5 = 66.193, r2 = 0.96, p < 0.001) and COT = 261.525 − 269.598U + 72.386U2 (dashed line through aerial running data only; F2,1 = 110.557, r2 = 0.99, p = 0.067). The areas between the vertical dashed lines (labelled tran) represent the range of speeds where a gait transition occurred.

