
Figure 2.
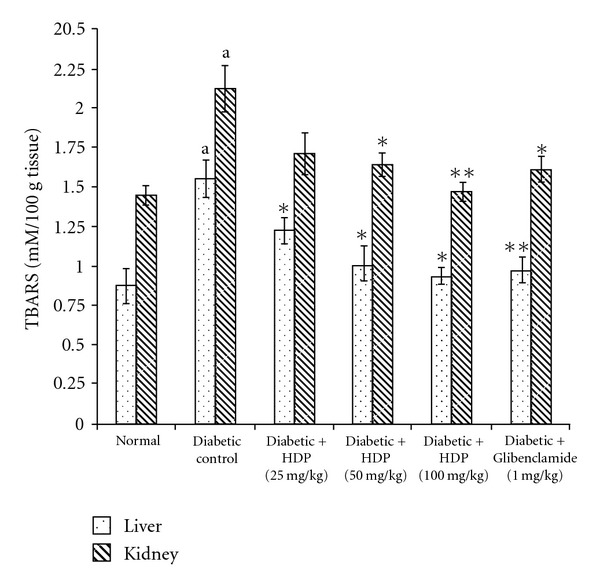
Effect of HDP on TBARS of hepatic and renal tissues of type 2 diabetic rats. Data are mean ± SE of six animals for each group. a P < .01 compared with normal control group. *P < .05 compared with diabetic control group, **P < .01 compared with diabetic control group.