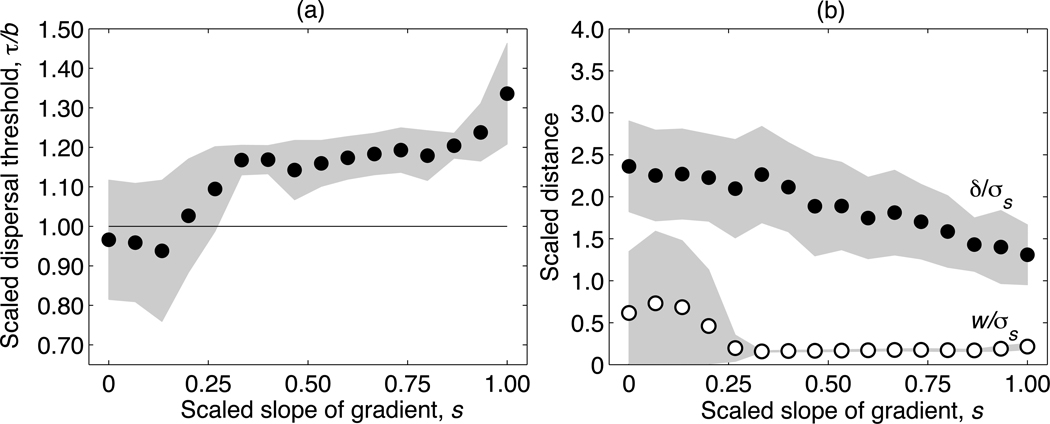
Fig. 6.
Evolved dispersal and mating strategies in sexual populations with Gaussian competition, shown as a function of the environmental gradient s, for the scaled competition width c = 1.0. The scaled threshold of the dispersal strategy τ/b is shown in (a) and both the scaled dispersal distance δ/σs and scaled mating distance w/σs are shown in (b). The horizontal line in (a) indicates the average death rate, d = 1.0. Filled circles show the average of the final 5000 generations of 100 independent realizations, and the gray-shaded areas represent the respective standard deviations across realizations.

