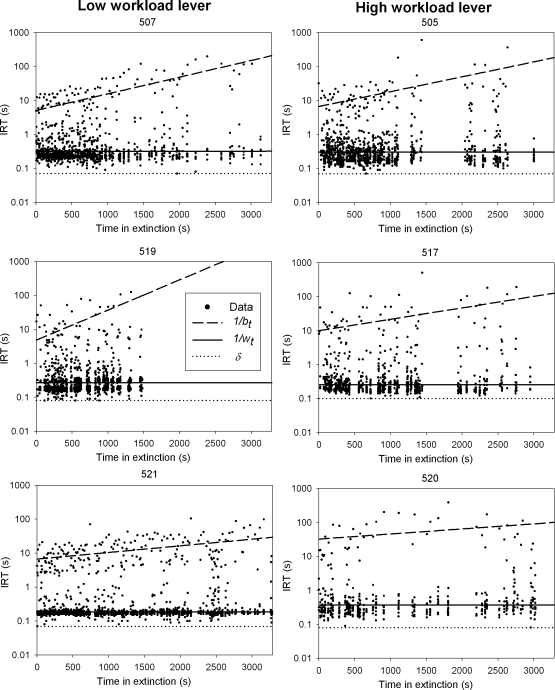
Fig 6.
Interresponse times (IRTs) as a function of time t in extinction. The broken, solid, and dotted lines are, respectively, traces of average bout initiation IRT (1/bt), average within-bout IRT (1/wt), and constant minimum IRT (δ), drawn from the dynamic refractory bi-exponential model selected in Table 4 and fitted using the maximum likelihood method. Traces of 1/bt have been joined by a smooth straight line for illustrative purposes (see main text).

