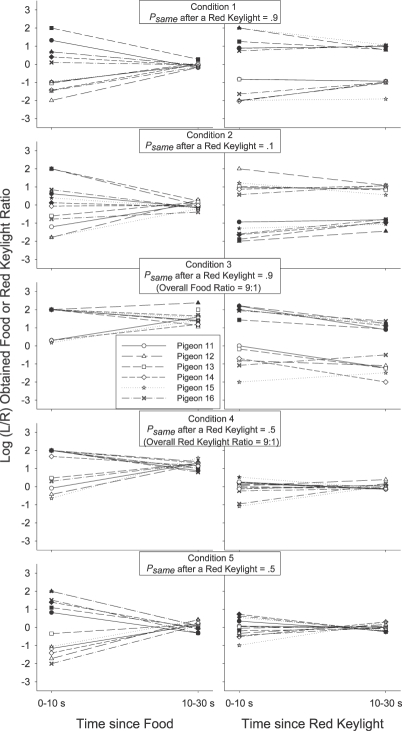
Fig 3.
Log (L/R) response-contingent event ratio 0 to 10 s and 10 to 30 s after a response-contingent food delivery (left panels) or red keylight (right panels) for each individual subject in each condition of Experiment 1. Filled symbols depict event (food or red keylight) ratios after a left event and unfilled symbols depict event ratios after a right event.

