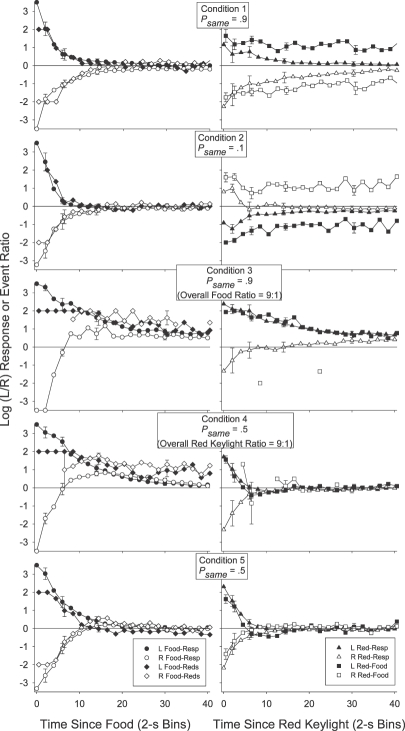
Fig 4.
Group mean log (L/R) response and response-contingent event ratios in successive 2-s time bins after a response-contingent food delivery (left panels) or red keylight (right panels) in each condition of Experiment 1. Error bars (±1 standard error) are plotted at representative data points, first at time bin 0, and then increasing in log2 units. The contingent-event pulses are shifted to the right of the response pulses by .5 s on the x-axis in order to aid comparison. The preference (behavior) pulses in this figure are reprinted from Figure 2.

