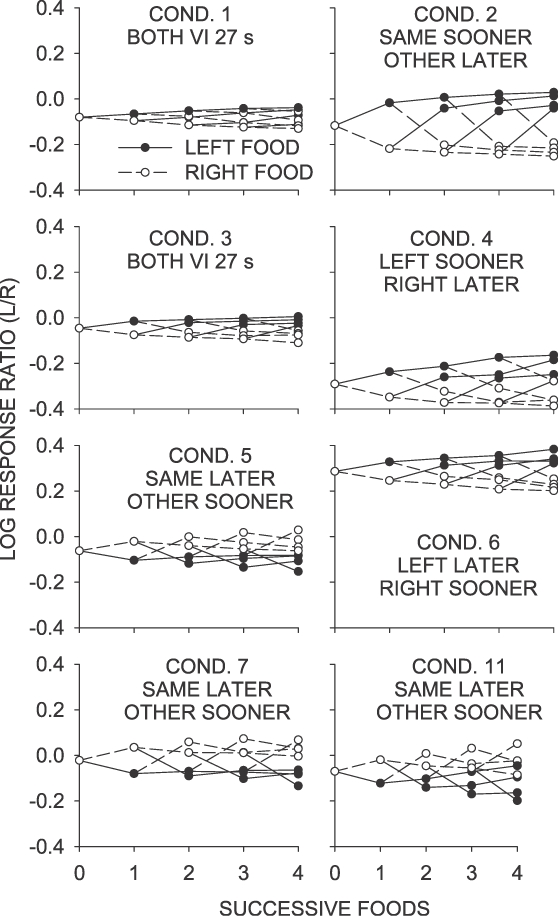
Fig 4.

Phase 1. Mean log response ratio within interreinforcer intervals as a function of successive food deliveries from left and right keys. Sequences analyzed overlapped—that is, the data points plotted for an x value if 1 were from any sequence ending in a left or a right reinforcer; for x = 2, the points were for any sequences ending in two left food deliveries, two right food deliveries, or left-right or right-left food deliveries.
