Fig A7.

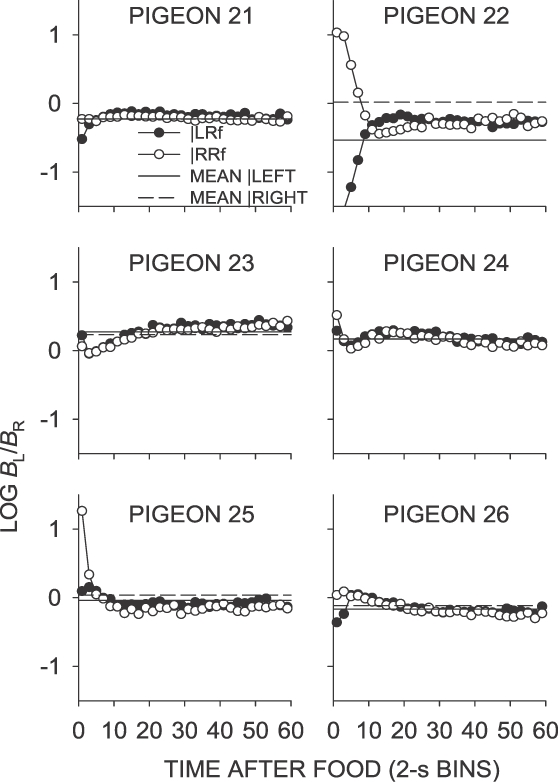
Phase 1, Condition 7. Log response ratio as a function of time since food, and mean extended-level preference, for Pigeons 21 to 26 according to the location of the last food delivery. The data are the last 65 sessions of this condition.

Phase 1, Condition 7. Log response ratio as a function of time since food, and mean extended-level preference, for Pigeons 21 to 26 according to the location of the last food delivery. The data are the last 65 sessions of this condition.