
Figure 2.
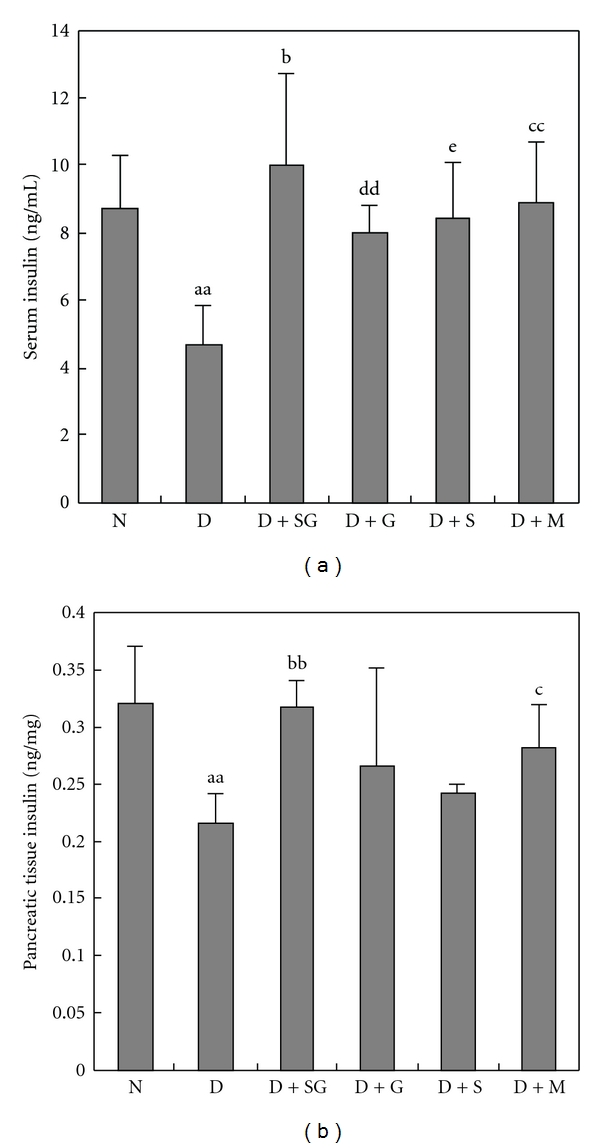
Serum and pancreatic tissue insulin levels detected by ELISA after 5 weeks of treatment (a and b). N, Normal control mice; D, diabetic control mice; D + SG, diabetic mice treated with scorpion (350 mg kg−1 per day) combined with gypsum (350 mg kg−1 per day); D + G, diabetic mice treated with gypsum (350 mg kg−1 per day); D + S, diabetic mice treated with scorpion (350 mg kg−1 per day); D + M, diabetic mice treated with metformin (250 mg kg−1 per day). Data were expressed as mean ± SD (n = 5). aa P < .01 “D” versus “N”; b P < .05, bb P < .01 “D + SG” versus “D”; dd P < .01 “D + G” versus “D”; e P < .05 “D + S” versus “D”.