
Figure 3.
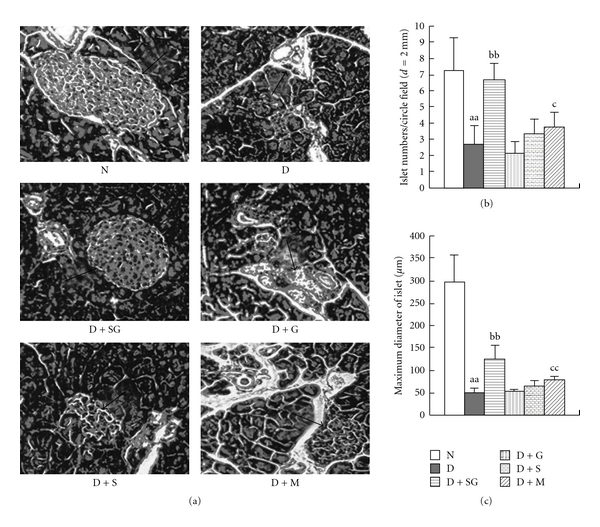
Images of H&E staining (×100 magnification) in pancreatic tissues of mice (a), pancreatic islet numbers (b), and maximum diameter of the Islets of Langerhans (c) (n = 5). Arrows indicate the Islets of Langerhans. N, Normal control mice; D, diabetic control mice; D + SG, diabetic mice treated with scorpion (350 mg kg−1 per day) combined with gypsum (350 mg kg−1 per day); D + G, diabetic mice treated with gypsum (350 mg kg−1 per day); D + S, diabetic mice treated with scorpion (350 mg kg−1 per day); D + M, diabetic mice treated with metformin (250 mg kg−1 per day). Data were expressed as mean ± SD (n = 5). aa P < .01 “D” versus “N”; bb P < .01 “D + SG” versus “D”; c P < .05, cc P < .01 “D + M” versus “D”.