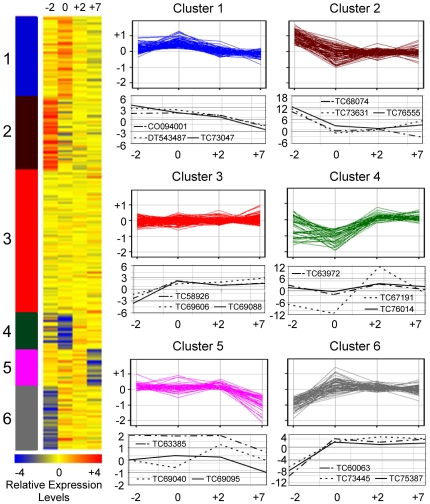
Figure 1. Comparative and K-means analyses of differentially expressed genes detected by microarrays.
A heat map of K-means cluster analysis of differentially expressed genes in protodermal cells (−2 DPA), fiber cell initials (0 and +2 DPA), and fibers (+7 DPA). Changes of gene expression in six Gene Ontology (GO) categories are shown with the expression patterns of three representative genes shown below each cluster graph. Cluster 1: kinase activity; 2: hydrolase activity; 3: transferase activity; 4: transcription factor; 5: DNA/RNA binding activity; and 6: structural molecule. Expression of representative genes was validated by qRT-PC. ID in parenthesis is updated from ICG10.

