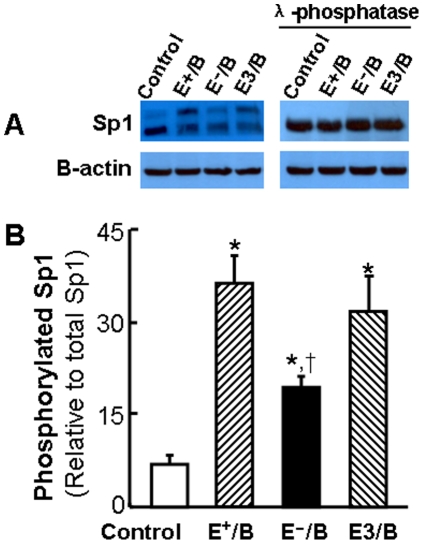
Figure 4. The effect of ApoE on lipoprotein-induced Sp1 phosphorylation.
Mouse macrophages were treated with 20 µg/ml of wild-type (E+/B), ApoE-free (EÎ/B) or ApoE3-enriched (E3/B) lipoproteins, or culture medium alone (control) for 4 hrs. The cell lysate were incubated with or without λ-phosphatase. Sp1 phosphorylation was detected by Sp1 immunoblot band shift induced by lipoprotein and λ-phosphatase treatments. The level of phosphorylated Sp1 was expressed as the percentage of the immunoreactive intensity of the top band versus the total (top plus bottom bands). Values represent the mean ± SEM of 3 separate experiments. * P<0.05 compared to control, † P<0.05 compared to E+ or E3 lipoprotein treatment.

