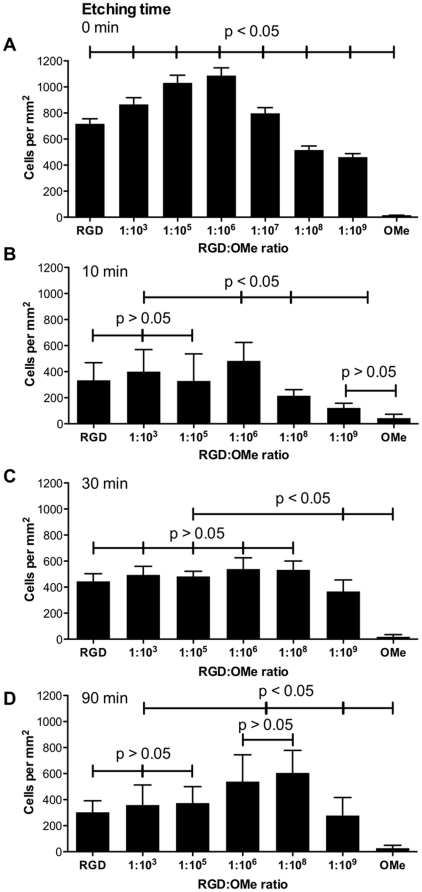
Figure 5. Quantification of the number of adherent endothelial cells on flat and on etched silicon surfaces.
(A) Number of endothelial cells after 30 min incubation with flat surfaces (A) and surfaces etched for 10 min (B), 30 min (C) and 90 min (D) for different RGD∶OMe ratios. The corresponding RGD densities are listed in Table 1. RGD stands for 100% RGD modification or 6×10¹¹ RGD/mm2. OMe is the anti-fouling modification and contains no RGD. Data correspond to at least three independent surface preparations and >10 images per surface. Error bars represent standard deviations. Significant differences between data points in A–D are indicated (p<0.05; p>0.05).

