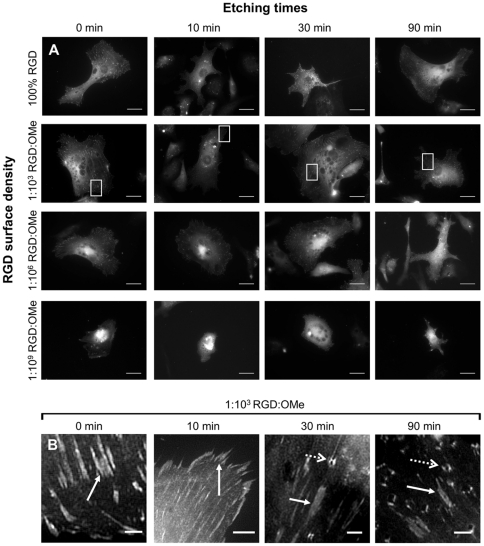
Figure 6. Confocal images of GFP-paxillin in adherent endothelial cells after 3 h incubation with surfaces with different topographical features, determined by the etching times, and RGD densities, defined by the RGD∶OMe ratio.
Dashed arrows point to the paxillin agglomerates, closed arrows point to ‘classical’ dash-shaped focal adhesions. Scale bar 20 µm (A), 2 µm (B).

