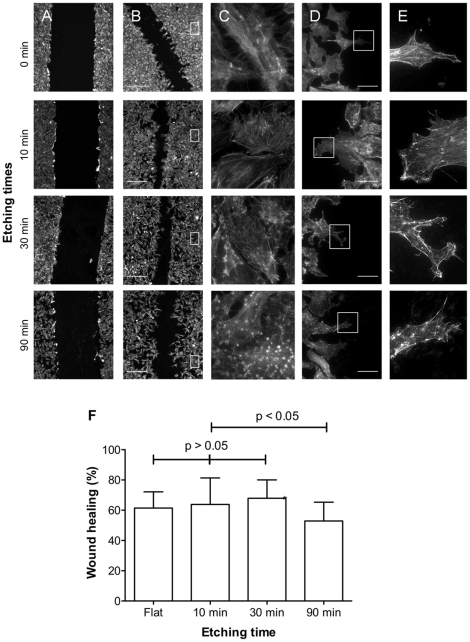
Figure 8. Endothelial cell migration over surfaces with different topographies, as defined by the etching time, and RGD surface densities of 6×10⁵ RGD/mm2 (1∶106 RGD∶OMe ratio).
(A) Wound immediately after scratching; (B–E) wound after a further 3 h incubation. (C) Zoomed images of cells some distance from the wound edge as indicated in B. (C–E) Zoomed of images of cells migrating into the wound. Cells were stained with phalloidin-Alexa Fluor 555. Scale bar 100 µm (A, B) and 20 µm (D). (E) Quantification of wound closer after 3 h incubation.

