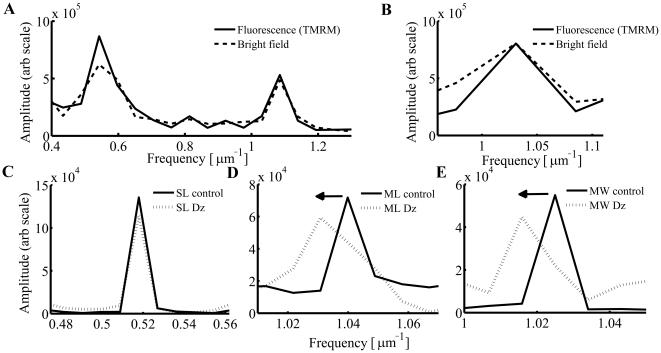
Figure 3. Cardiomyocyte structural determinants of principal Fourier transform spectral peaks: assignment and validation.
Consecutive Fourier analysis along length (A) and width (B) directions calculated from bright field and fluorescence images of tetramethylrhodamine methyl ester (TMRM) loaded cardiomyocytes. Low concentrations of diazoxide (Dz; 30 µM) did not shift the sarcomere peak (C), but shifted the frequency of the mitochondrial peak (D) along the length-axis and (E) width-axis to the left by ∼1%.

