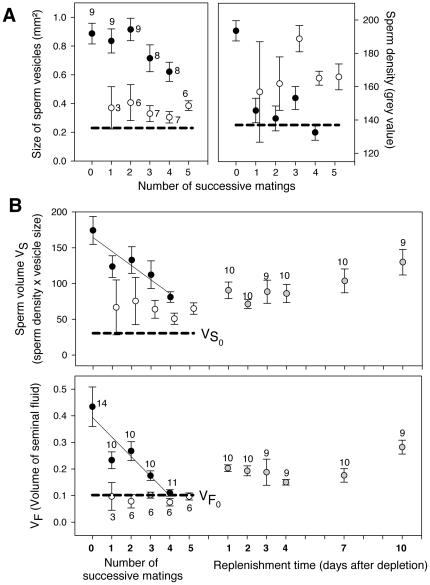
Figure 3. Ejaculate allocation over successive matings in the common bedbug, Cimex lectularius.
The data points show cross sections of males after a number of matings in a) the size of sperm vesicles and sperm density, b) sperm volume (VS) and c) seminal fluid volume (VF). Black circles show sexually isolated males after a number of prescribed matings. The solid lines show linear least-square curve fittings. White circles show males drawn at random from a population that were examined after they stopped mating. Stippled lines show the value of the respective parameter at eclosion, i.e. a value below which mating is impossible. Grey circles show the replenishment of VS and VF of ejaculate depleted males in relation to time since sexual isolation. Circles represent means, error bars 1 standard error. Sample sizes are stated near the mean values. Sample size in Figure 3a and b are identical.

