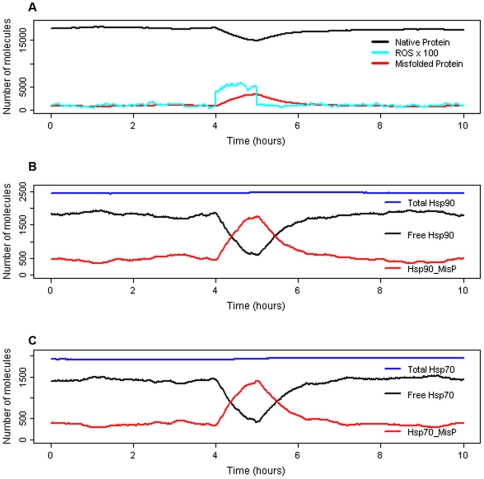
Figure 5. Simulation results for moderate/transient stress.
ROS levels were increased by a factor of 4 at time t = 4 hours for a period of 2 hours. One typical simulation result is shown. A Native protein, total misfolded protein (includes misfolded bound by Hsps), and reactive oxygen species (ROS). ROS are scaled x100 to allow easier visualisation. B Total Hsp90 (free pools plus all complexes), Free Hsp90 (unbound Hsp90) and Hsp90_MisP (Hsp90 bound to misfolded protein). C Total Hsp70 (free pools plus all complexes), Free Hsp70 (unbound Hsp70) and Hsp70_MisP (Hsp70 bound to misfolded protein).

