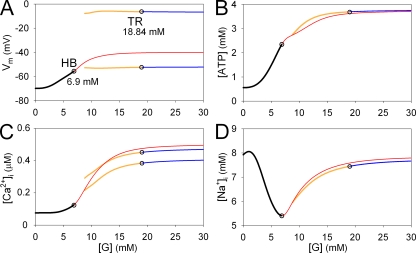
Figure 1.
Changes in EPs and LCs in the whole β-cell model by varying [G]. Four bifurcation diagrams showing continuous changes in EPs or LCs for Vm (A), [ATP] (B), [Ca2+]i (C), and [Na+]i (D) with respect to [G]. Stable EPs, unstable EPs, stable LCs, and unstable LCs are indicated by black, red, blue, and yellow lines, respectively. For LCs, the maximum and minimum values in oscillations were plotted. The amplitude of oscillation in [ATP] and [Na+]i was small, and the maximum and minimum curves of LCs fused with each other. AUTO failed to find unstable LCs at [G] < 9 mM. Open circles indicate bifurcation points; HB, Hopf bifurcation from a stable EP to an unstable EP (at 6.9 mM [G]); TR, Torus bifurcation from a stable LC to an unstable LC (at 18.84 mM [G]).

