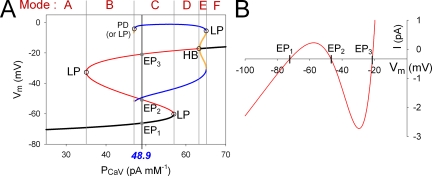
Figure 2.
Mode changes of membrane excitability by varying PCaV. (A) Bifurcation diagrams showing continuous changes in Vm of EPs or LCs as a function of PCaV. Stable EPs, unstable EPs, stable LCs, and unstable LCs are indicated by black, red, blue, and yellow lines, respectively. The black line for a stable EP corresponds to the resting membrane potential, and the two blue lines for a stable LC correspond to the amplitude of the action potentials. The slow variables were fixed to the following values: [ATP] = 2.64 mM, [MgADP] = 0.0591 mM, [Re] = 0.61 mM, [Na+]i = 5.87 mM, [K+]i = 127 mM, [Ca2+]i = 0.124 µM, [Ca2+]ER = 0.0247 mM, fus = 0.843, and I1 = 0.152. Open circles indicate bifurcation points; LP, LP bifurcation; HB, Hopf bifurcation; PD, period doubling bifurcation. Black vertical lines with the blue italic numeral indicate control values of PCaV (48.9 pA mM−1) in the β-cell model. EP1, EP2, and EP3 (gray dots) are the intersections of the EP curve with the black vertical line. Gray vertical lines passing through the corresponding bifurcation points separate individual modes, as indicated at the top. (B) Steady-state I-V relationship. Zero current potentials correspond to EP1, EP2, and EP3 in A.

