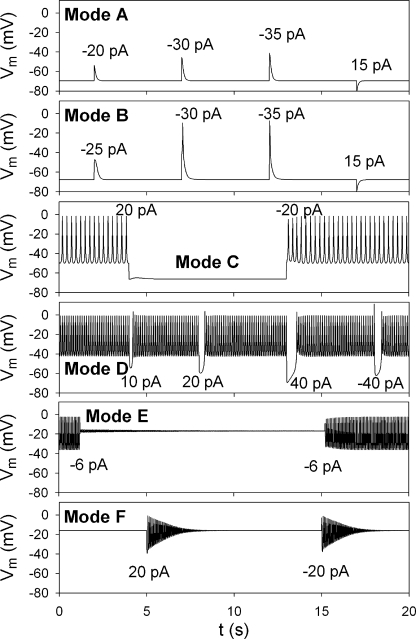
Figure 3.
Representative membrane responses to current injections in different modes. The amplitudes of injected current pulses are indicated inside panels. Duration of the pulse was 5 ms, except 15 ms in Mode E. In each panel, a different value of PCaV was used for simulation (units in pA mM−1): Mode A, PCaV was 30; Mode B, 45; Mode C, 48.9; Mode D, 60; Mode E, 65; Mode F, 69. The same values were used for the slow variables as in Fig. 2. The time axes were identical for all panels.

