Figure 4.
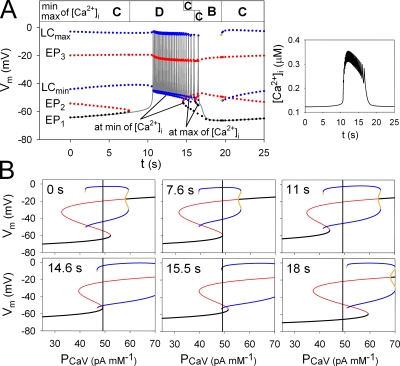
Time-dependent mode changes in membrane excitability during one burst–interburst cycle. (A) Time-based simulation of Vm at 8 mM [G] (gray continuous line). Colored dots are EP1, EP2, EP3, and LC (min and max) in the membrane system, which were measured from the bifurcation diagrams calculated with fixed values of [S]is, [Ca2+]ER, fus, and I1 at corresponding time points. Stable EPs, unstable EPs, stable LCs, and unstable LCs are indicated by black, red, blue, and yellow dots, respectively. The unstable LC (yellow) was only observed at the moment of mode change from Mode B to C (19.5 s) during <0.1 s, whereas it was not observed at the switch from Mode C to B during the burst (15.5 s). During the burst period, two sets of EPs and LCs were demonstrated at the sequential maximum or minimum of [Ca2+]i. These two EP3s are almost superimposed in the figure. The mode of membrane excitability at each moment is indicated at the top. (Inset) Trace of [Ca2+]i during the same burst–interburst cycle. (B) Bifurcation diagrams at six representative time points in A, as indicated in the top left part of the figure. During the burst, three time points were selected from those of sequential minimums of [Ca2+]i (11, 14.6, and 15.5 s). The same color codes were used for the dots as those in A. Black vertical lines were drawn at PCaV = 48.9 pA mM−1, the standard value in the β-cell model.

