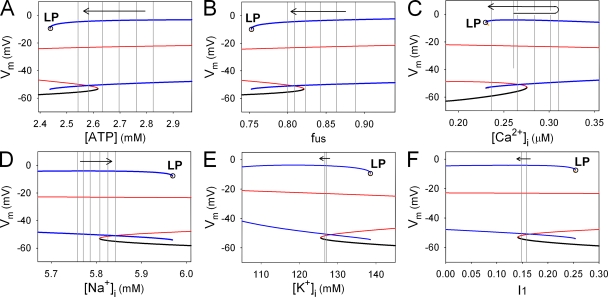
Figure 5.
Effects of individual slow variables on the mode change toward termination of the burst. Each bifurcation diagram was obtained by varying single slow variable, [ATP] (A), fus (B), [Ca2+]i (C), [Na+]i (D), [K+]i (E), and I1 (F) as a bifurcation parameter, with the remaining slow variables fixed at their values at 0.9 s before the LP bifurcation (open circles). Stable EPs, unstable EPs, stable LCs, and unstable LCs are indicated by black, red, blue, and yellow lines, respectively. Six gray vertical lines in A–D indicate the values of the corresponding slow variables sampled at an interval of 1 s (from 11 to 16 s in Fig. 4 A). In C, the sequential values of the minimum [Ca2+]i were sampled. In E and F, two gray lines indicate the corresponding values at 11 and 16 s. Arrows represent the sampling sequence. We confirmed that the bifurcation diagrams were qualitatively the same when slow variables were fixed at different time points during the burst.

