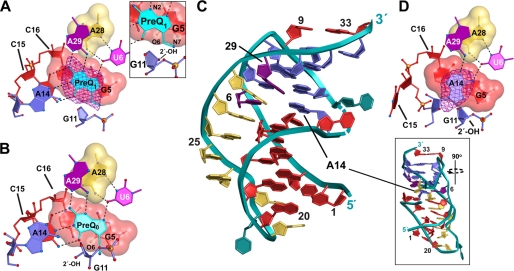
FIGURE 2.
Schematic representations of the preQ1 riboswitch in the free and preQ1-bound states. A, aptamer interactions with preQ1 looking down the helical axis of the riboswitch. The “floor” of the binding pocket is shown as a space-filling model; putative hydrogen bonds are shown as dashed lines. The location of the ligand is indicated by an averaged “kicked” (66) or AK (mFo − DFc) omit electron density map with σA weighting contoured at 4σ; the ligand (cyan) was removed from the phase calculation. Inset, close-up view of the preQ1 methylamine in relation to the G11 2′-OH group and the G5 O6 keto moiety. Neighboring groups of G5 are highlighted with a semitransparent circle and labeled; the electron density has been removed for clarity. B, aptamer interactions with preQ0 based on Protein Data Bank entry 3cga as described previously (22). C, ribbon diagram of the free-state riboswitch. The phosphate backbone is depicted as a teal ribbon with bases colored as in Fig. 1B; inset, a view rotated 90° to accentuate the location of A14 within the ligand-binding pocket. D, schematic diagram depicting A14 of the free-state structure; the purine base was removed from the phase calculation to generate an AK (mFo − DFc) omit map as in A.

