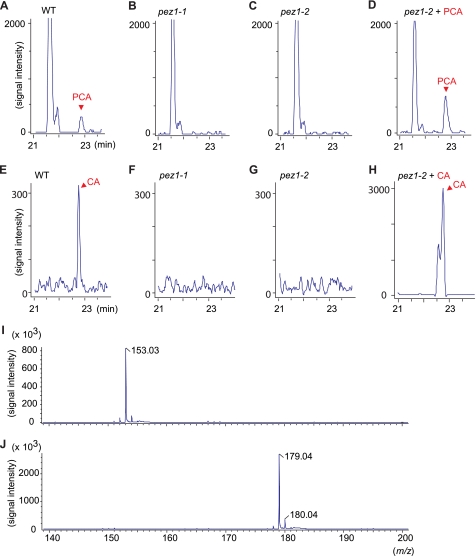
FIGURE 2.
PCA was decreased in the xylem sap of pez1 mutants. Mass chromatograms [PCA-H]− m/z 152.5–153.5 of the xylem sap of WT (A), pez1-1 (B), pez1-2 (C), and pez1-2 + 500 μm PCA (D). A peak in PCA appeared at 22.8 min. Mass chromatograms [CA-H]− m/z 178.5–179.5 of the xylem sap of WT (E), pez1-1 (F), pez1-2 (G) and pez1-2 + 500 μm CA (H). Also shown are mass spectrometry of PCA (I) and CA (J).

