FIGURE 7.
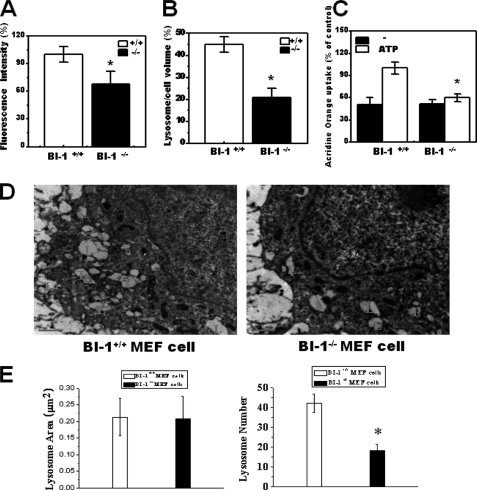
Lysosome activity and lysosomal number are decreased in BI-1 knock-out cells. BI-1 +/+ and BI-1 −/− cells were exposed to 5 μm LysoTracker, and images were captured. A and B, fluorescence intensity (A) and area per cell (B) were quantified. C, acridine orange solution and valinomycin were added to lysosomal membranes; intravesicular H+ uptake was measured in the presence or absence of Mg-ATP, and the uptake ratio was quantified. D and E, electron microscopy was performed (D), and the lysosome area and the number of lysosome per cell were quantified (E). In panel D, L indicates lysosomes. *, p < 0.05; significantly different from BI-1+/+ MEF cells. In panels A–C and E, each value is expressed as the mean ± S.E. of three independent experiments.

