FIGURE 6.
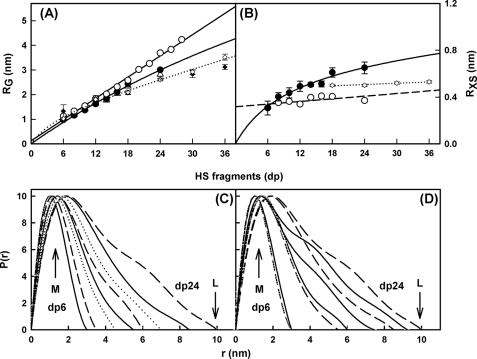
Experimental Guinier and P(r) x-ray data analyses of eight HS dp6–dp24 fragments. A, comparison of the experimental RG values from Guinier plots (△) and P(r) curves (●) with the predicted RG values calculated from the linear models of Fig. 4 (○). The six corresponding values for heparin from (19) are denoted by open and filled diamonds, respectively, and fitted to a dotted line. B, comparison of the experimental cross-sectional RXS values (●) with the predicted RXS values calculated from the linear models of Fig. 4 (○). The corresponding four values for heparin dp18–dp36 from Ref. 19 are denoted by open diamonds and fitted to a dotted line. C, the distance distribution function P(r) analyses for dp6–dp24. The r values of the maximum at M were 1.02 nm (dp6), 1.15 nm (dp8), 1.30 nm (dp10), 1.43 nm (dp12), 1.44 nm (dp14), 1.61 nm (dp16), 1.87 nm (dp18), and 1.90 nm (dp24). The eight fragments are denoted by continuous, dashed, and dotted lines in alternation. D, comparison of the P(r) analyses for HS dp6–dp24 with heparin dp6–dp24. The curves corresponding to the four HS fragments dp6, dp12, dp18, and dp24 are denoted by dashed lines, whereas the corresponding four curves for heparin are denoted by continuous lines. The heparin P(r) data are from Ref. 19.

