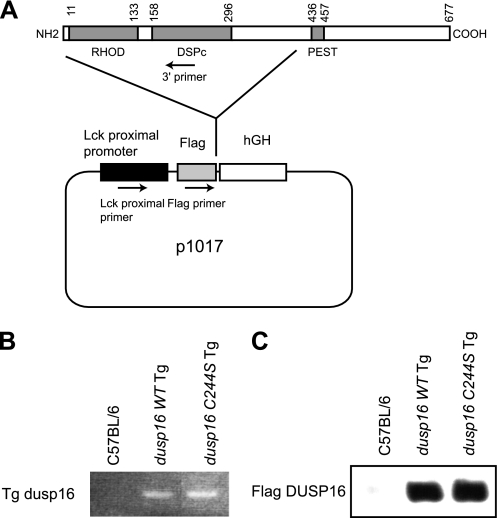
FIGURE 4.
Generation of the transgenic mice and genotyping. A, schematic representation of constructs for transgenic mice. B, PCR identifying the expected genotypes of Tg mice using DNA extracted from mouse tails. C, Western blot analysis of total cellular protein (50 μg each) prepared from splenic T cells from the mice using anti-FLAG mAb. The expression levels of DUSP16 in the Tg mice are shown.

