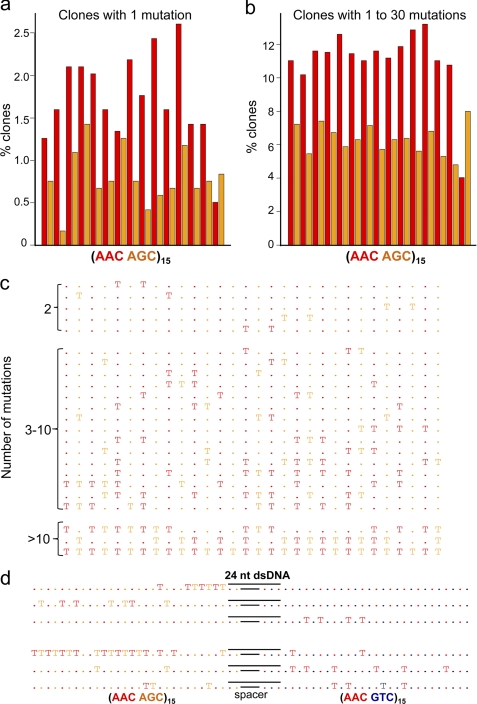
FIGURE 3.
Mutation spectra for AAC hot-AGC hot′ motifs. The spectra were obtained by sequencing individual clones from the constructs (Fig. 1, b–d) and combining the data from all of the left-hand cassettes composed of alternating AAC and AGC motifs. a, mutation spectrum for clones with a single deamination. b, mutation spectrum for clones with 1–30 deaminations. c, representative clones having 2, 3–10, and >10 mutations. The bars shown in a and b give the percent of clones with mutations at each AAC motif (red) or AGC motif (orange). c, T shown in red or orange denotes deaminated AAC and AGC motifs, respectively; the dots in red or orange denote nondeaminated AAC and AGC motifs, respectively. d, representative mutated clones on the construct composed of AAC hot-AGC hot′ and AAC hot-GTC cold motifs containing a 24-nt dsDNA region. Clones with mutations on both sides of the dsDNA region imply jumping.

